
Predicting Insurance Demand with Cultural Variables
As part of our ongoing series, below is a blog written by a team of actuaries and students who presented about the use of cultural variable analyses in insurance at Pinnacle University (Pinnacle U) in March 2022.
For insurance companies who wish to understand existing markets and enter new and emerging markets, being able to accurately predict insurance demand is critical.
Currently, demand for insurance is predicted predominately by analyzing economic factors (e.g., gross domestic product [GDP], inflation rate). However, we often see gaps in insurance demand between two different countries, despite the similarity of those countries’ economic conditions. This difference indicates that insurance market dynamics cannot always be captured through economic conditions, or through an economic analysis.
Clearly, some additional new and improved rating variables would be useful to more effectively predict insurance demand in different markets.
Culture helps us better understand risk perception, which is how people view and understand risk. Two people with the same risk tolerance viewing an identical risk may develop drastically different perceptions of its impact. The cultural backgrounds of the two individuals are foundational in developing their respective senses of risk perception. Understanding that disparity is fundamental in understanding insurance demand – so, could cultural variables act as new and improved independent variables to determine risk perception?
To understand the potential helpfulness of cultural variables in assessing insurance demand, our Pinnacle University team looked at three different cultural summaries – Hofstede’s Cultural Dimensions, the Happiness Index and the Human Development Index. Our team quantitatively analyzed the cultural factors of each summary and their relationships with insurance demand, as measured by insurance penetration, which is defined as the ratio of insurance premium written to the overall GDP.
Hofstede Cultural Dimensions
In the 1960s, internationally renowned social psychologist Geert Hofstede conducted a worldwide study of employees in multiple industries in an attempt to define a set of national values.
He identified systematic differences in national cultures in four primary dimensions:
- Power Distance: the degree of inequality within a society that people consider normal
- Individualism: the preference of people to perform for their self-interests ahead of the interests of a small social unit
- Uncertainty Avoidance: a country's degree of preference for structured situations
- Masculinity/Femininity: a cultural tendency for having distinct gender roles
In 2012, a University of Pennsylvania team utilized Hofstede’s dimensions as predictor variables in a linear regression with insurance penetration as the target variable1. The results of the analysis are shown below in Figure 1:
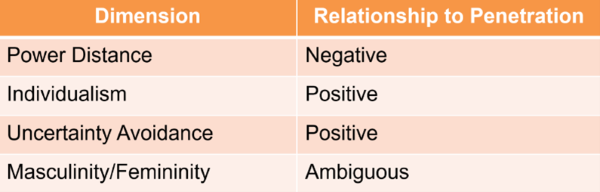
Figure 1
Ultimately, the results show that insurance companies looking to enter new markets may be able to achieve more significant penetration by identifying countries that score “low” in Power Distance and “high” in Individualism and Uncertainty Avoidance.
However, there is an important caveat to consider. For the University of Pennsylvania study, countries were categorized as “high-income” or “low-income” using an income per capita of $20,000 as a cut-off point. The study results indicated that high-income countries found all cultural variables significant (except for Masculinity/Femininity), whereas low-income countries found only Power Distance significant.
In other words, Individualism and Uncertainty Avoidance’s relationship to insurance penetration was too weak to consider for low-income countries. This finding supports the indication that cultural analysis can be supplemental to economic analysis. While culture, of course, permeates all aspects of life in all layers of societies, its influence on insurance seems to be only felt after basic needs, such as food, clothing and shelter, are satisfied.
Human Development Index
The Human Development Index (HDI) was created by the United Nations Development Program in the 1990s to emphasize that certain characteristics of a citizenry are better criteria than economic growth for assessing a country’s development.
The HDI uses three key dimensions of human development: education, health and financial stability.
In our analysis, education and health are considered cultural variables, while financial stability is an economic variable. Health is measured by life expectancy. Education is measured by average years of schooling for adults and by expected years of schooling for new students. Financial stability is measured by gross national income per capita, or the total amount of money earned by a nation's people and businesses.
Our analysis involved two linear regression models. The first was a univariate regression, with the HDI as the explanatory variable and insurance penetration as the response. Our calculations found that the HDI had a significant, positive relationship to insurance penetration.
The second was a multivariate linear regression that used the HDI’s components as explanatory variables and insurance penetration as the response. We found that gross national income and life expectancy had significant, positive relationships with insurance penetration. Education variables, however, had an ambiguous or insignificant relationship with insurance penetration. Life expectancy’s significant positive relationship directly supports our claim that cultural variables are productive in helping to predict insurance penetration.
Happiness Index
To study happiness and how it may impact insurance demand, we utilized the World Happiness Report, created by the United Nations Sustainable Development Solutions Network.
This report assigns a happiness score to an individual nation, determined by a variety of metrics, such as measures of people’s trust in their governments or what level of social support they have.
Our original hypothesis stated that happier people may be more willing to purchase insurance to preserve their happiness via an increased feeling of stability. After testing our hypothesis by running different models through the Happiness Index data, our results were inconclusive. However, a graphical analysis showed some linear relationships between happiness variables and insurance penetration. For example, two happiness variables – “Social Support” and “Human Expectancy” – can be seen in Figures 2 and 3:
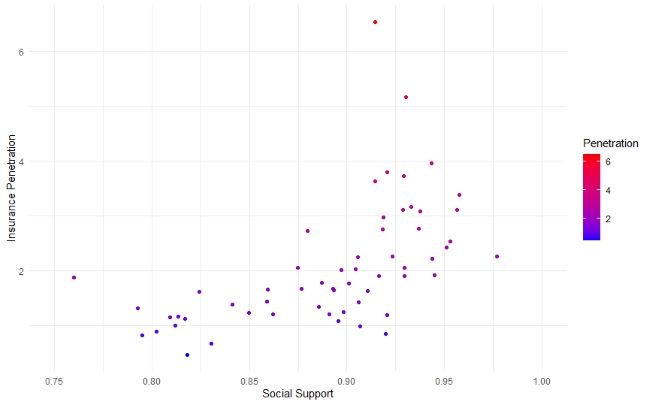
Figure 2
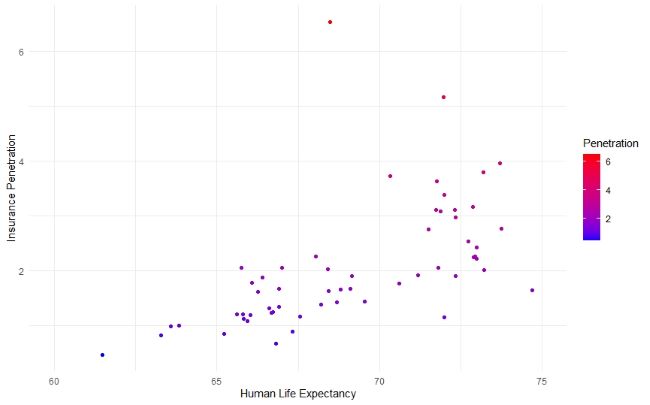
Figure 3
Similar studies offer competing theories about happiness and its relationship with risk; our findings mirror these conflicting results. For example, the Affect Infusion Model (AIM) (Forgas, 1995) says that positive moods lead to risk-seeking behavior, whereas the Mood Maintenance Hypothesis (MMH) suggests positive moods cause risk-averse behavior. Such model disagreements are evidence that the insurance industry may consider further research into understanding cultural factors as they relate to risk, risk-related behaviors and insurance penetration.
Our Pinnacle U team believes that analyzing cultural shifts alongside economic variables can more accurately explain and predict insurance penetration, because economically identical countries do not have the same demand for insurance. By quantitatively analyzing variables found in cultural summaries, insurers can better understand the risk perception of customers to grow existing markets and explore new target markets.
For more information on the type of linear regression used in the preceding analyses, see guide located here: https://www.scribbr.com/statistics/linear-regression-in-r/
1Park, S., & Lemaire, J. (2012). The Impact of Culture on the Demand for Non-life Insurance)
Alec Panayotov is an actuarial analyst I with Pinnacle Actuarial Resources in the Chicago office. He holds a Bachelor of Science degree in actuarial science with a minor in business administration from the University of Illinois at Urbana/Champaign, and has experience in assignments involving predictive analytics, microcaptive loss reserving and loss funding. He is actively pursuing membership in the Casualty Actuarial Society (CAS) through the examination process.
Jaidev Goel is currently enrolled in the Master of Science actuarial program at the University of Texas at Dallas. He is actively pursuing his membership in the Society of Actuaries (SOA) through the examination process.
Joe Alberts is an actuarial analyst II with Pinnacle Actuarial Resources in the Chicago office. He holds a Bachelor of Science degree in mathematics with a minor in physics from Illinois Wesleyan University, and has experience in assignments involving loss reserving, loss cost projections and group captives. He is actively pursuing membership in the CAS through the examination process.
News & Insights

What Recessions Reveal About Property and Casualty Insurance Dynamics

How the Insurance Industry is Navigating the Complex Debate Over Fairness in Pricing

Keeping It Clean: Understanding Pollution Liability Insurance and Its Future
